FROM THE EDITOR: 'What Are We Doing?'
Stanford Report Teases Out Complexities of Educational Achievement
By Martin Davis
EDITOR-IN-CHIEF
Email Martin
How important is testing? And what should be done about poor test scores?
That was the question a former teaching colleague and I bounced about this past week over Old-Fashioneds at a local downtown watering hole.
The spark for the discussion was a former student — now in their early 30s and working successfully in a profitable career. The student had failed their Third-Grade SOL in reading in elementary school, and instead of being allowed to pass it as a Fourth-Grader was forced to take a Fourth-Grade SOL reading test the following year. A test the student failed. In fact, this person failed their Reading SOL all the way through high school.
And yet, this student managed to rise above it. Key to the student’s success was my colleague, who helped him learn to read — not well enough to pass the SOL; well enough to learn to navigate life.
Most students who fail SOLs year after year aren’t as fortunate, which led to a foundational question. Why not let a kid pass one test before pushing them into a another that they’re almost certain to fail? (To pass a Fourth-Grade SOL after failing the Third-Grade variety, the student would theoretically have to make up two years of academic achievement.)
“What are we doing?” my former colleague asked.
Better Data Shows a Big Problem
There is broad agreement that something is profoundly wrong with traditional public education. For more than a quarter century, teachers have been alternately blamed for the problem and charged with fixing the problem, despite there being precious little insight into what the problem is.
This is due in part to the data that is used to highlight the problem. Despite all the data collected, it is rarely used to show more than pass-fail rates. Observing pass-fail rates has its place, but it does nothing to explain why students are struggling. Nor does it provide any insight into how to address it.
Enter the education quacks, who offer an endless stream of gimmicks and curricula and strategies and “professional developments” that have plagued educators for a quarter century. The array of endless quick fixes rolls through school districts like viral videos. Rick Hess described it this way in a recent post about his research into education reform trends:
Every one of the 57 urban systems I studied was adopting every kind of reform I was looking at. Over the three years I examined, the typical district launched 13 major reforms—that’s more than one every three months. Reform was a ceaseless whirlwind that exhausted educators and bred cynicism.
That helps explain my former colleague’s frustration. Years of one magic-pill solution after another naturally leads to his question: What are we doing?
A new report out of Stanford University this week, the Educational Opportunity in the U.S., 2019-2025 report, should help bring some clarity to this discussion.
What Makes This Study Different?
The data that underlies the Educational Opportunity in the U.S. report is not new. It’s based upon the same state testing scores and NAEP (The Nation’s Report Card) scores as most education research is based on. What is different is how the information is mapped.
The report uses this baseline data to bring into focus four broad “Educational Opportunity Metrics.” These are:
Average Test Scores — This shows where a district’s state’s students are relative to the national average of students.
Learning Rates — This shows the percent students learn each grade, relative to the national average of students.
Trend in Test Scores — This shows the average change in test scores each year.
Trend in Learning Rates — This shows the average change in learning rates each year.
The raw test score data is built upon the state exam results that each state administers to students in 3rd - 8th grade — the data was collected through the National Center for Education Statistics at the U.S. Department of Education.
Because each state’s test is based on the standards it creates and is unrelated to other states, state scores are “harmonized” by using data from NAEP — The Nation’s Report Card. This allows researchers to compare states’ academic achievement relative to one another.
So what are the take-aways?
Let’s start with the highlights.
What we are doing is not working — According to reporting in the New York Times, “Compared with a decade earlier, reading scores were down last year in 83 percent of school districts where data was available. Math scores were down in 70 percent.”
Don’t blame poverty, race, or geography — The New York Times report also notes that “The declines have affected both rich and poor districts, and crossed racial and geographic divides.”
The decline began well before the pandemic — In fact, it began in 2015 and has hardly slowed.
Why this is happening — There is no conclusive answer to that question, though the proliferation of social media and screen time is one of several suspected factors.
Where Does Virginia Stand?
Over the past two years, CNBC’s Best States for Business has ranked Virginia No. 1 in education — a rating that bolstered Virginia’s business ranking in the study.
The Educational Opportunity Report paints a more-nuanced picture.
Virginia students in 2025 were performing 0.39 grade levels below the 2019 national average. Further, test scores in Virginia have been changing at a rate of -0.03 grade levels/year since 2022.
Academic performance ratings in math and reading are far from best-in-class. While Virginia does rank 20th of 51 states in average math performance over the 2022-2025 school years, it rates 31st of 51 states in reading.
More concerning, however, are the state’s learning rates. These “measure how much students’ scores improve as they progress from grade to grade,” making them a “better indicator of school quality than average test scores.”
By this metric, Virginia doesn’t even break into the top half of states, ranking 31 out of 51.

How Our Readership Area Ranks
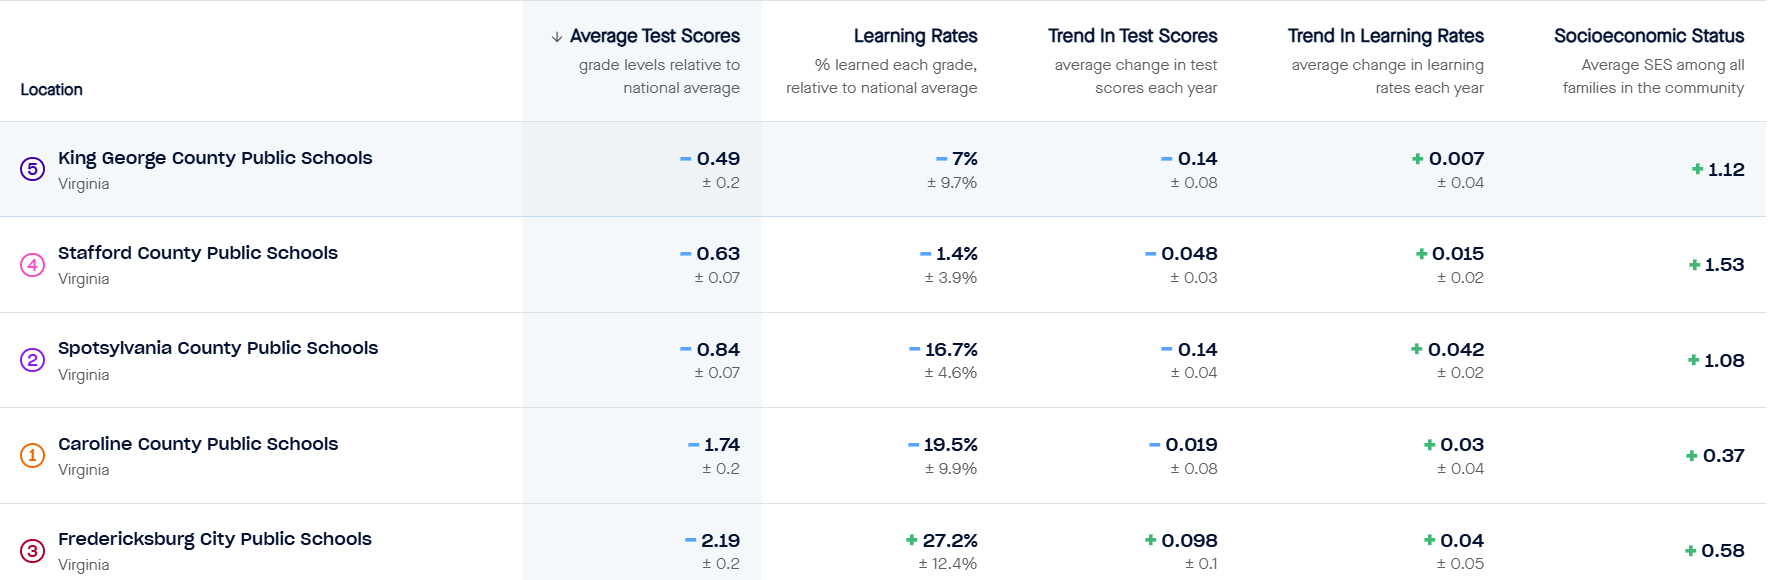
An analysis of educational opportunity in Caroline, Fredericksburg, King George, Spotsylvania, and Stafford show some shared traits.
Across the board, the five school districts in our readership area are below grade level relative to the national average.
Each of the school districts are also in communities with a socioeconomic status above the national average.
Each of the school districts shows positive trends in learning rate.
There are, however, some notable outliers.
While all five localities are below national grade level on test scores, two are more than one full grade-level below the national average.
Caroline County - 1.74 grade levels below the national average
Fredericksburg City - 2.19 grade levels below the national average
Four of the five localities have learning rates below the national average. Stafford County public schools is closest to the national average, being just 1.4% below. Spotsylvania (16.7%) and Carolina (19.5%) show the worst performance in the area.
In contrast, Fredericksburg City schools is 27.2% above the national average.
How to explain the gap between students’ tests being more than two-grade levels below the national average, while students are learning 27.2% more than the national average?
It may be as simple as Fredericksburg City Schools score so poorly on standardized tests that they have nowhere to go but up.
However, it is also likely that there are some positive things happening in third- through eighth-grade that are making a difference and need to be isolated and replicated.
Conversely, Caroline and Spotsylvania County schools should be asking why their learning trends scores are as poor as they are. In Spotsylvania, is it tied to the disruption that consumed the school board and led to an exodus of educators and administrators between 2022 and 2025? Or were there other factors at play?
A Richer Picture
This new set of data from Stanford is not perfect. There are issues, for example, with using NAEP scores to “harmonize” state scores. Every student must take the state exams. Not every student takes NAEP. Indeed, just a small percentage do, raising questions about the validity of using a sampling exam to normalize an exam that every student must take.
Short a national standards exam, however, this is the best tool at our disposal.
But without doubt a far richer picture of learning emerges.
Districts with extremely poor test scores (Fredericksburg City) do show some evidence of doing something right, for example. This should focus policymakers and educators and Board members on isolating those factors and working with them.
It also serves as a check on the best performing schools. Stafford County Public Schools, for example, may be closest to the national average in learning rates, but it is still below the national average. And there are a number of school districts in Virginia above that average that Stafford could learn from.
The more refined the picture our data gives us, the closer we come to answering the key question my colleague asks: “What are we doing?”
This data shows we’re not doing enough. It also shows, however, where we need to step up our game as well as which districts to turn to that may actually have lessons to offer.
Download the Reports for Our Region’s Districts


Local Obituaries
To view local obituaries or to send a note to family and loved ones, please visit the link that follows.
