Tuesday January 31, 2023
ANALYSIS: 'Constitutional' Sheriffs | DEEP READ: Educational Expectations | Observed: Curitiba
Editor’s Note: The “Constitutional Sheriff” movement is an extremist organization that looks to be growing. The Southern Poverty Law Center describes it this way: “The concept of the constitutional sheriff is a subset of the larger antigovernment movement. Its origins are in the American county supremacy movement, which includes two concepts that often work in tandem. One is that county government should have control of all the land within its borders, taking this power away from the state and federal government. The other is focused on the role of the county sheriff, who they believe has ultimate law enforcement authority in the United States.” While the sheriffs of Spotsylvania and Stafford are not members, Scott Jenkins of Culpeper, Virginia, is. This article from The Conversation discusses the movement and the dangers associated with it.
Sheriffs who see themselves as ultimate defenders of the Constitution are especially worried about gun rights
by Mirya Holman of Tulane University and Emily Farris of Texas Christian University
Originally published at The Conversation

A gun control law signed by Gov. J.B. Pritzker of Illinois in January 2023 immediately faced opposition from a group key to the law’s enforcement: sheriffs. They are county-level, locally elected public officials who run jails, provide courthouse security, and, in many counties, are the primary providers of law enforcement services.
In Illinois, and around the nation, some sheriffs also view themselves as the ultimate defenders of the U.S. Constitution and its rights – even though there’s no law and no history giving them that position.
In Illinois, approximately 80 of the state’s 102 sheriffs oppose the Protect Illinois Communities Act, a law that banned the sale and distribution of assault weapons, high-capacity magazines and switches that convert firearms to assault weapons. Anyone who owned those items before the law passed in January 2023 must register them with the state. Most of the sheriffs who opposed it issued statements saying they believe the law violates the Second Amendment to the U.S. Constitution, and therefore they will not be enforcing it.
Sheriff Justin Oliver of Brown County, for example, posted a public statement on the office’s Facebook page, on letterhead. The statement says he swore to protect the rights provided in the Constitution and he believes that the act violates the Second Amendment, so “as chief law enforcement officer for Brown County … neither myself nor my officers will be checking to ensure that lawful gun owners register their weapons with the State, nor will we be arresting or housing law abiding individuals.”
In our research surveying sheriffs, in 2012 and again in 2021, we have found that sheriffs are far more likely to support looser gun laws than the public at large. And we have also found that that perspective is linked to some sheriffs’ views that they are the highest level of defenders of the U.S. Constitution and Americans’ constitutional rights.
A last line of defense?
We traced sheriffs’ views of themselves as ultimate protectors of the Constitution to the Constitutional Sheriffs and Peace Officers Association, a political organization founded in 2009 by Richard Mack, a former sheriff of Graham County, Arizona.
Mack first gained notoriety in right-wing circles as a plaintiff in Printz v. United States, decided by the U.S. Supreme Court in 1996. In its ruling, the court declared a portion of the 1993 Brady Handgun Violence Prevention Act unconstitutional. The ruling said the law’s requirement for state and local officials to perform background checks on prospective gun buyers violated the 10th Amendment, which limits how much influence the federal government can have on state and local governments.
The association, which Mack founded after former President Barack Obama’s election, calls itself a network of (self-described) “constitutional sheriffs” that encourages sheriffs to refuse to enforce laws they believe to be unconstitutional and to resist overreach by the federal government.
Its key idea dates back further, though, to Posse Comitatus. That was a white supremacist, antisemitic right-wing movement in the 1970s that believed as part of its conspiratorial ideology that the county sheriff held the ultimate government authority in the United States. This view is not historically accurate, nor is it found in the U.S. Constitution.
Nevertheless, Mack and his organization have spent more than a decade actively recruiting and training sheriffs to believe that their office is more powerful than the president, and that they can reject laws they believe to be unconstitutional. Mack told NPR in 2019 that sheriffs “have the responsibility to interpose – it’s the ‘doctrine of interposition’ – whenever anybody is trying to diminish or violate the individual rights of our counties.”
Their own views
This movement of so-called “constitutional sheriffs” has been particularly successful at recruiting more sheriffs into its ideology around issues of guns, immigration and COVID-related policies.
The resistance in Illinois is not the first effort of sheriffs to resist gun control. When Obama pushed for national gun control legislation after the 2012 Sandy Hook Elementary School shooting in Newtown, Connecticut, Mack’s group recruited more than 450 sheriffs and 19 state sheriff associations to oppose federal gun control efforts.
Similarly, when the state of Washington passed a gun safety measure in 2018, sheriffs statewide opposed the measure and threatened not to enforce it because they said it violated people’s constitutional rights.
And in Illinois, its followers continue to stand in the way of the law, even though they lack any legal justification for doing so. State and federal officials have called on Illinois sheriffs to enforce the law, as their oaths of office require. But many sheriffs continue to say they get to determine which laws to enforce, even if their constituents disagree.
Educational Expectations
by Matt Hurt, director of the Comprehensive Instructional Program in Wise, Virginia
Since the Region VII superintendents initiated the Comprehensive Instructional Program in 2014, we have annually identified our top-five most-successful teachers of our most at-risk students in each SOL tested course. In these teachers’ classes, at least 50% of their students were economically disadvantaged, and they also had a significant number of students with disabilities.
Despite that, their SOL pass rates were very high, even higher than many teachers’ pass rates who had few economically disadvantaged students and no students with disabilities. When asked, all of these teachers have conveyed a common theme: they expected their students to pass the SOL test, and the teacher believed it was his/her job to ensure that happened.
Similarly, we find the theme of high expectations rampant in our most successful schools and divisions in our high poverty areas. For example, Wise County and Norton City were the two divisions that outperformed the relationship between poverty rates and SOL performance in 2022 (as well as several years prior). This relationship accounted for 30% of the variation in overall SOL scores among all one hundred and thirty-two divisions that year. The poverty rate in these two divisions is greater than approximately 90% of other school divisions in the state, and they are also typically the least well-funded two divisions in Virginia when considering overall per-pupil funding. Despite those challenges, these two divisions outperformed 95% of all other divisions in 2022.
Figure 1
2022 Overall Division Pass Rates Compared to Federal Poverty Rates
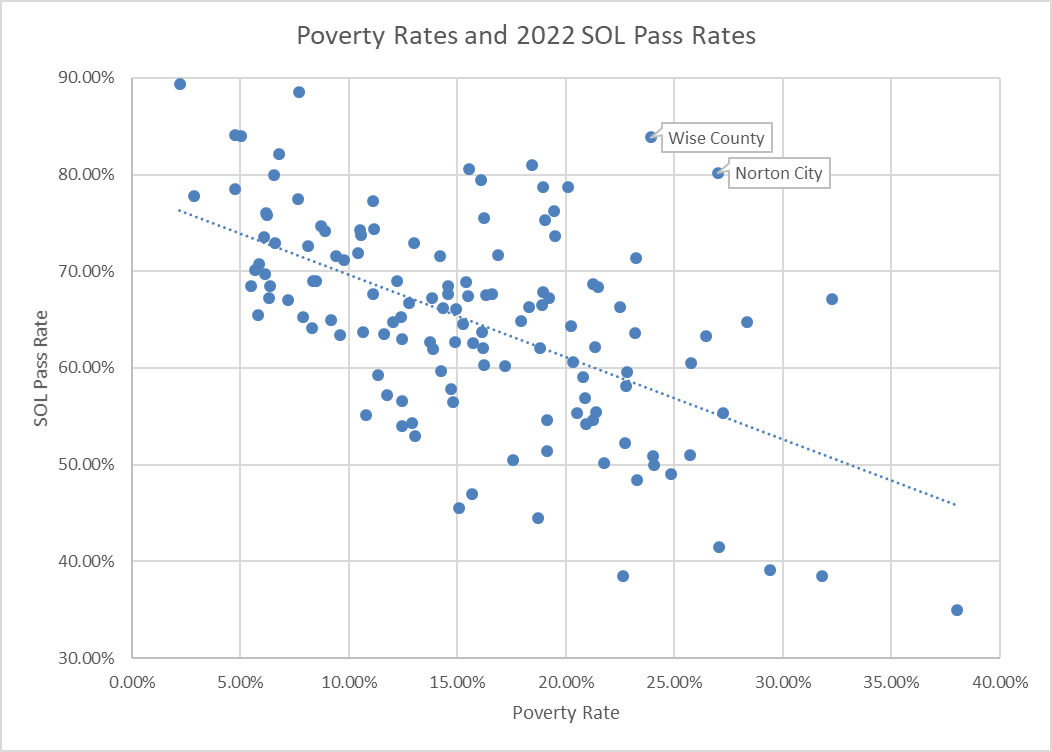
One of the secrets to success in Wise County and Norton City is that they have very high expectations. Their teachers expect their kids to be successful on their SOL tests. If at any time throughout the year a student demonstrates he or she is unlikely to be successful, the teacher provides that student extra instruction outside of class time to fix the problem. Their administrators expect their students and teachers will be successful, and they take great pains to ensure that happens.
Teachers are empowered to make instructional decisions they believe will help their students be more successful. Teachers and administrators are also held accountable, as student outcomes (such as SOL pass rates) are included in their evaluation goals and account for a very significant part of their summative evaluations.
We have found that expectations vary wildly among classrooms, schools, and divisions. If we were to poll educators across the state and ask what are your expectations (high, moderate, or low), it is likely that the vast majority of respondents would answer “high”. It is very evident that not all educators have the same definition of “high” in this context.
Since expectations are a relatively intangible concept, we decided that we need to make this more concrete. Through working with teachers and administrators over the years, we came upon the idea of comparing final course grades of our students to their SOL test score that is associated with that course. Generally, a student’s final grade for the course is a measure of how that student performed relative to the teacher’s expectation. Similarly, the student’s SOL score is a measure of the student’s performance relative to the state’s expectations. The initial hypothesis was that the closer final grades aligned to SOL proficiency, the higher the SOL pass rates would be.
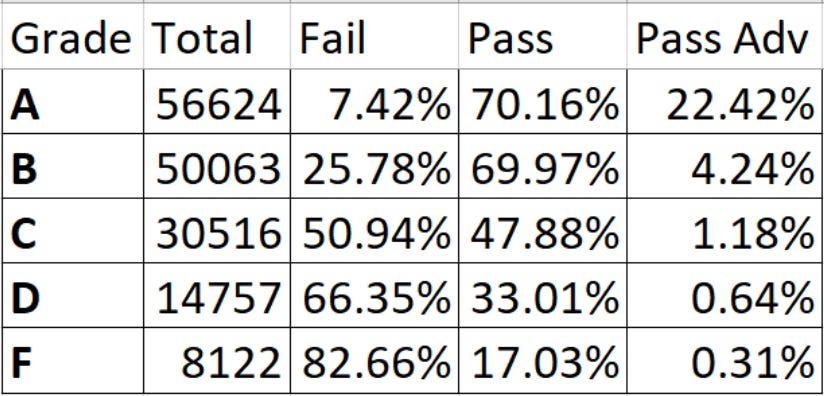
We initially tested this hypothesis in 2019 by analyzing the data of 35 public school divisions and followed that with an analysis of data from 43 divisions in 2022. Table 1 illustrates the distributions of final course grades among these 43 divisions in 2022. This data indicates that there was a significant gap between educator expectations and the expectations set forth by the state.
Table 1
Distribution of Final Grades and SOL Proficiencies among Forty-three School Divisions in 2022
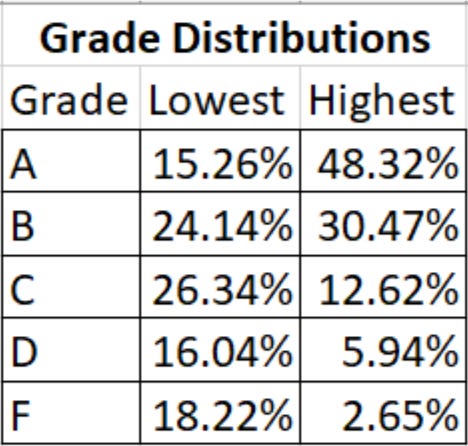
To illustrate the range of distributions, Table 2 displays the distributions of final course grades and SOL proficiencies for the highest and lowest performing divisions in this dataset. In the lowest performing division, almost one-fourth of the students who earned an A for the course failed the SOL test associated with that course, compared to less than 2% in the highest performing division. The fact that the final grade of A constituted significantly less of the lowest performing division’s data (Table 3) indicates that this problem is likely more significant.
Table 2
Distribution of Final Grades and SOL Proficiencies for the Highest and Lowest Performing Divisions in 2022 among the Forty-three School Divisions in this Dataset
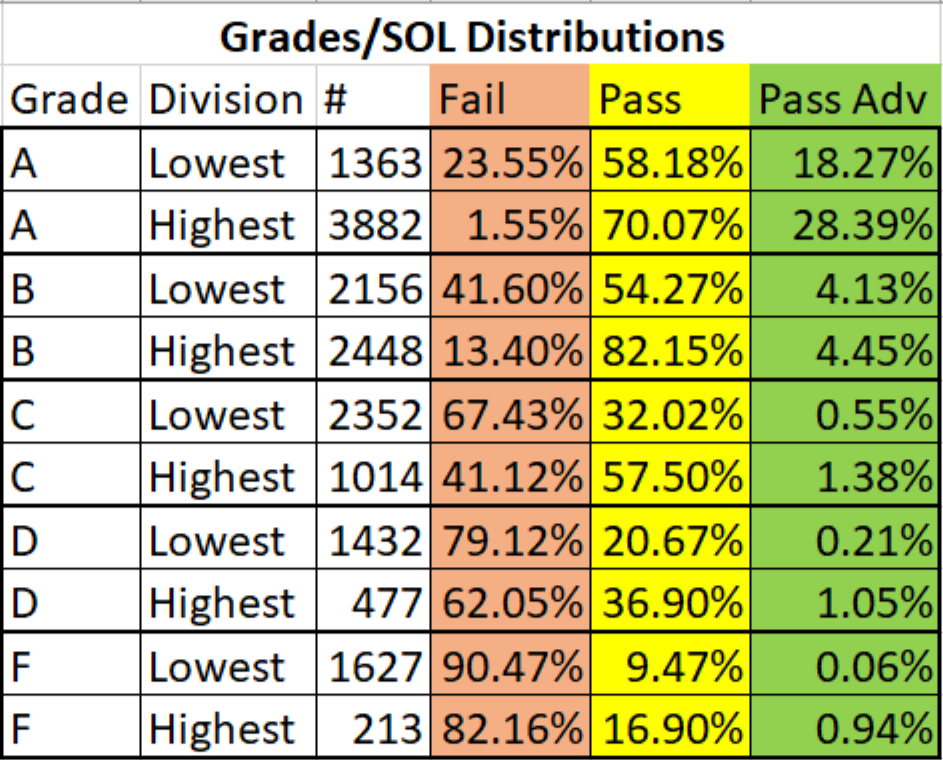
Table 3
Distribution of Final Grades for the Highest and Lowest Performing Divisions in 2022 among the Forty-three School Divisions in this Dataset
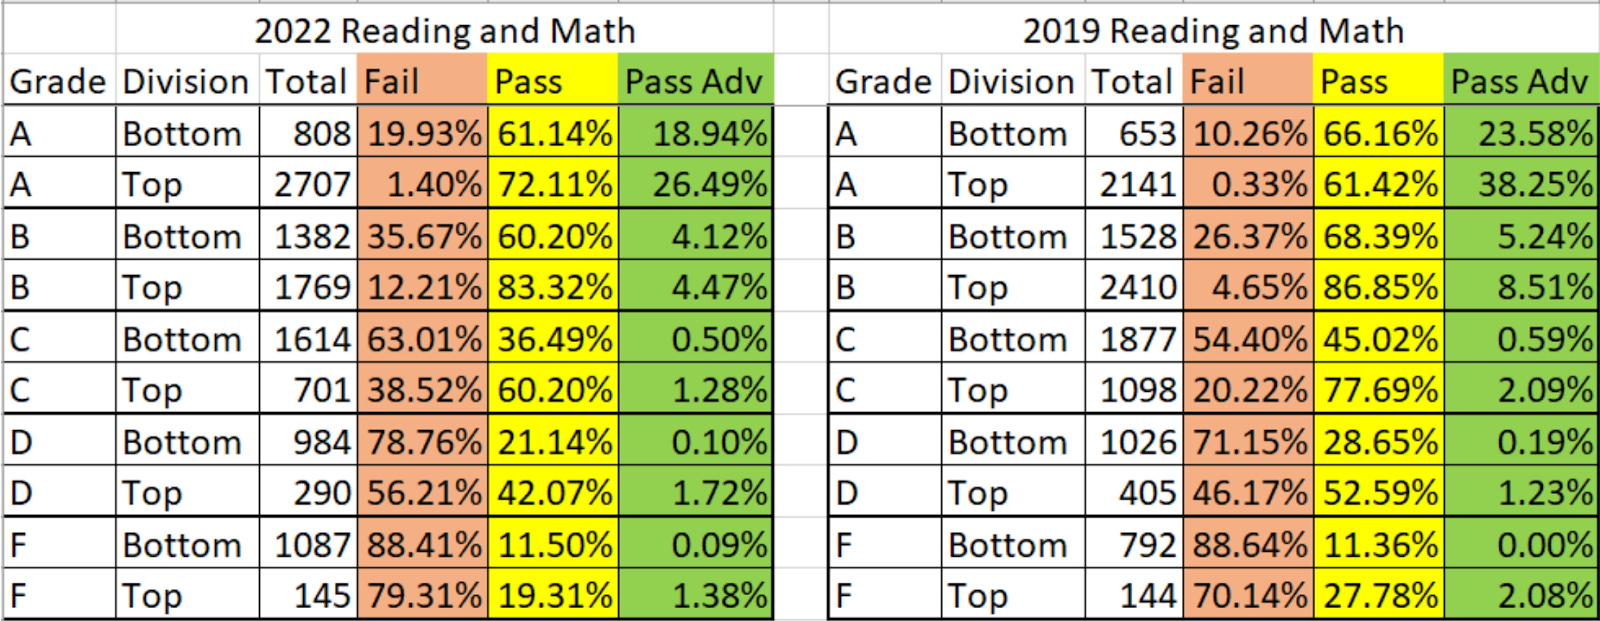
During the initial analysis of the data in 2019, persistent alignment problems were identified, but not to the same degree as we realized in 2022. Table 4 below illustrates how the alignment of expectations significantly shifted negatively from 2019 to 2022. It is extremely likely that a number of issues associated with our educational response to the Covid Pandemic caused these statistics to skew negatively.
Table 4
Distribution of Final Grades for the Highest and Lowest Performing Divisions in 2019 and 2022
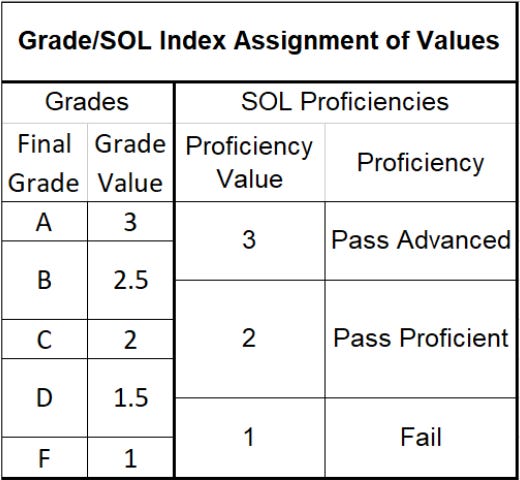
To conduct the statistical analysis of this dataset, the SOL score of each student was matched with the final course grade associated with that SOL test. The alpha values for grades and SOL proficiencies were re-coded to numeric values (see Table 5) very intentionally for two reasons.
Traditional assumptions of the level of performance that grades represent
A’s and high B’s have traditionally been considered advanced grades. Any score on the SOL test above 499 is by definition an advanced score
C’s have been considered dead average. The average student SOL score among our dataset was significantly above 400 (passing)
The lowest passing grade on the 10 point grading scale is a 60%, and the lowest passing score on the SOL test is a 400.
Grade/SOL proficiency distributions of our most successful teachers of our most at-risk students
Their students who earn A’s and B’s for the course either score pass advanced or pass proficient on the SOL test.
All of the students who earn C’s typically pass their SOL test.
Sometimes a student who earns a D will pass the SOL test, and sometimes will fail.
Table 5
Conversion of Alpha Values for Grades/SOL Proficiencies to Numeric Values
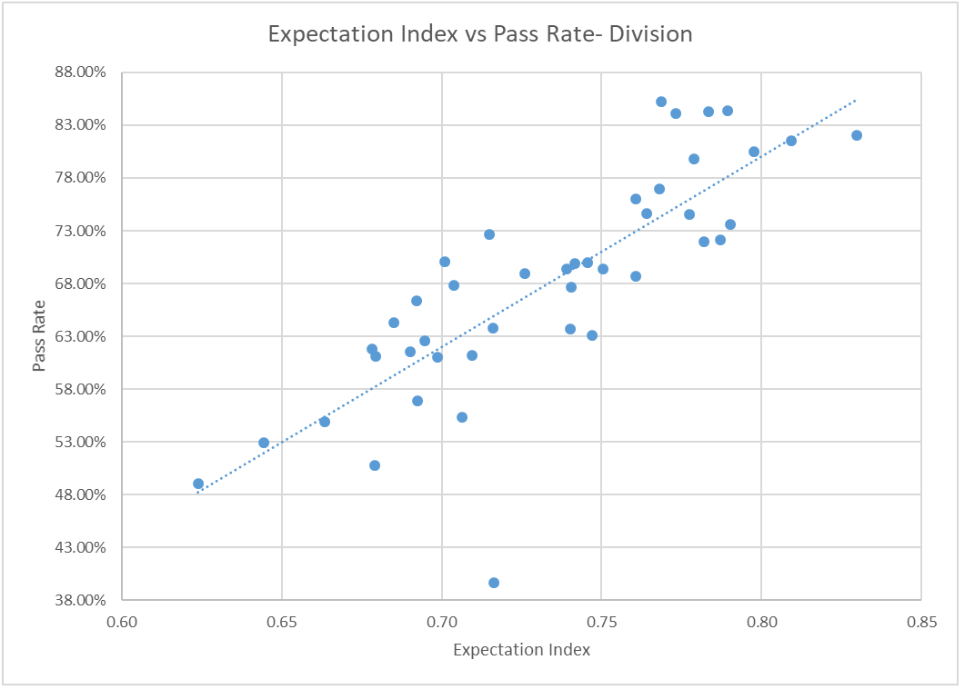
Once the data was re-coded, we calculated what we termed the “Expectation Index”. To do this, we divide the sum of the SOL proficiency values by the sum of the sum of the grade values at the division, the school, and the teacher level. Theoretically, the closer the Expectation Index value is to one, the more aligned the expectations are to those of the state.
Figure 2 demonstrates the relationship between division Expectation Index and pass rates in 2022. Among these forty-three divisions, the Expectation Index explained sixty-five percent of the variation in SOL pass rates. If the single outlier division at the bottom of the distribution were removed from that calculation, the Expectation Index would explain seventy-five percent of the variation among the remaining forty-two divisions.
Figure 2
Relationship Between Division Expectation Index and SOL Pass Rates
It is important to note that it is not reasonable to strive for perfect alignment of final course grades and SOL proficiencies. Our teachers are not issued standardized students, nor are our principles issued with standardized teachers. There are so many human variables in the mix that one would be driven mad trying to ensure perfect alignment. However, when we exhibit significant numbers of kids who earn A’s, B’s, or C’s that fail their SOL tests, we have a major problem that negatively impacts our students.
It is also important to consider the various factors that go into grading. For example, most teachers do not like conflict and will go to certain ends to avoid it. Parents and administrators do not like to see low grades, and sometimes that may encourage padding grades or creative weighting of grades to avoid potential conflicts.
Policies also impact grading outcomes. Some school boards and a number of administrators have mandated that teachers record no grade in their gradebooks below a fifty. In divisions on a ten point grading scale, if a fifty is the lowest possible grade, a student doesn’t have to engage with very much of the content at all in order to pass the class. Not only does this policy affect the alignment of grades and SOL proficiencies, it also disincentivizes student effort.
Similarly, in many of the Individual Education Plans (IEPs) of students with disabilities, accommodations are written that require students to only complete 50% of each assignment. Most teachers only require students to do the amount of work necessary to master the skills they are expected to teach.
Therefore, it is unrealistic for a student with a disability to master grade level skills if they’re not expected to do enough work to be successful. If anything, a student with disabilities should be provided additional support and opportunities to engage with the content. In our schools that have mitigated the gaps between their students with disabilities and their non-disabled students, that’s exactly what they do - provide more for those students, not expect less.
The correlations between the Expectation Index and SOL pass rates has been the most significant factor that we have studied. The table below demonstrates a number of factors that we found had a significant effect on the SOL pass rates of public school divisions in 2022. The statistics associated with the Expectation Index come from those forty-three divisions that participated in our study, and the other statistics were derived from the data of all one hundred and thirty-two public school divisions in Virginia. All of those factors except for the Expectation Index are outside of the control of our educators.
Table 6
Relationships Between Various Factors and Division SOL Pass Rates in 2022
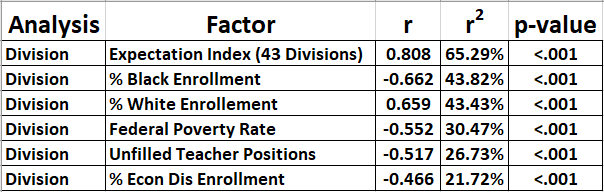
It is extremely encouraging to demonstrate that the efforts of educators matter more with regards to student outcomes than factors educators can’t control.
Observed
Curitiba
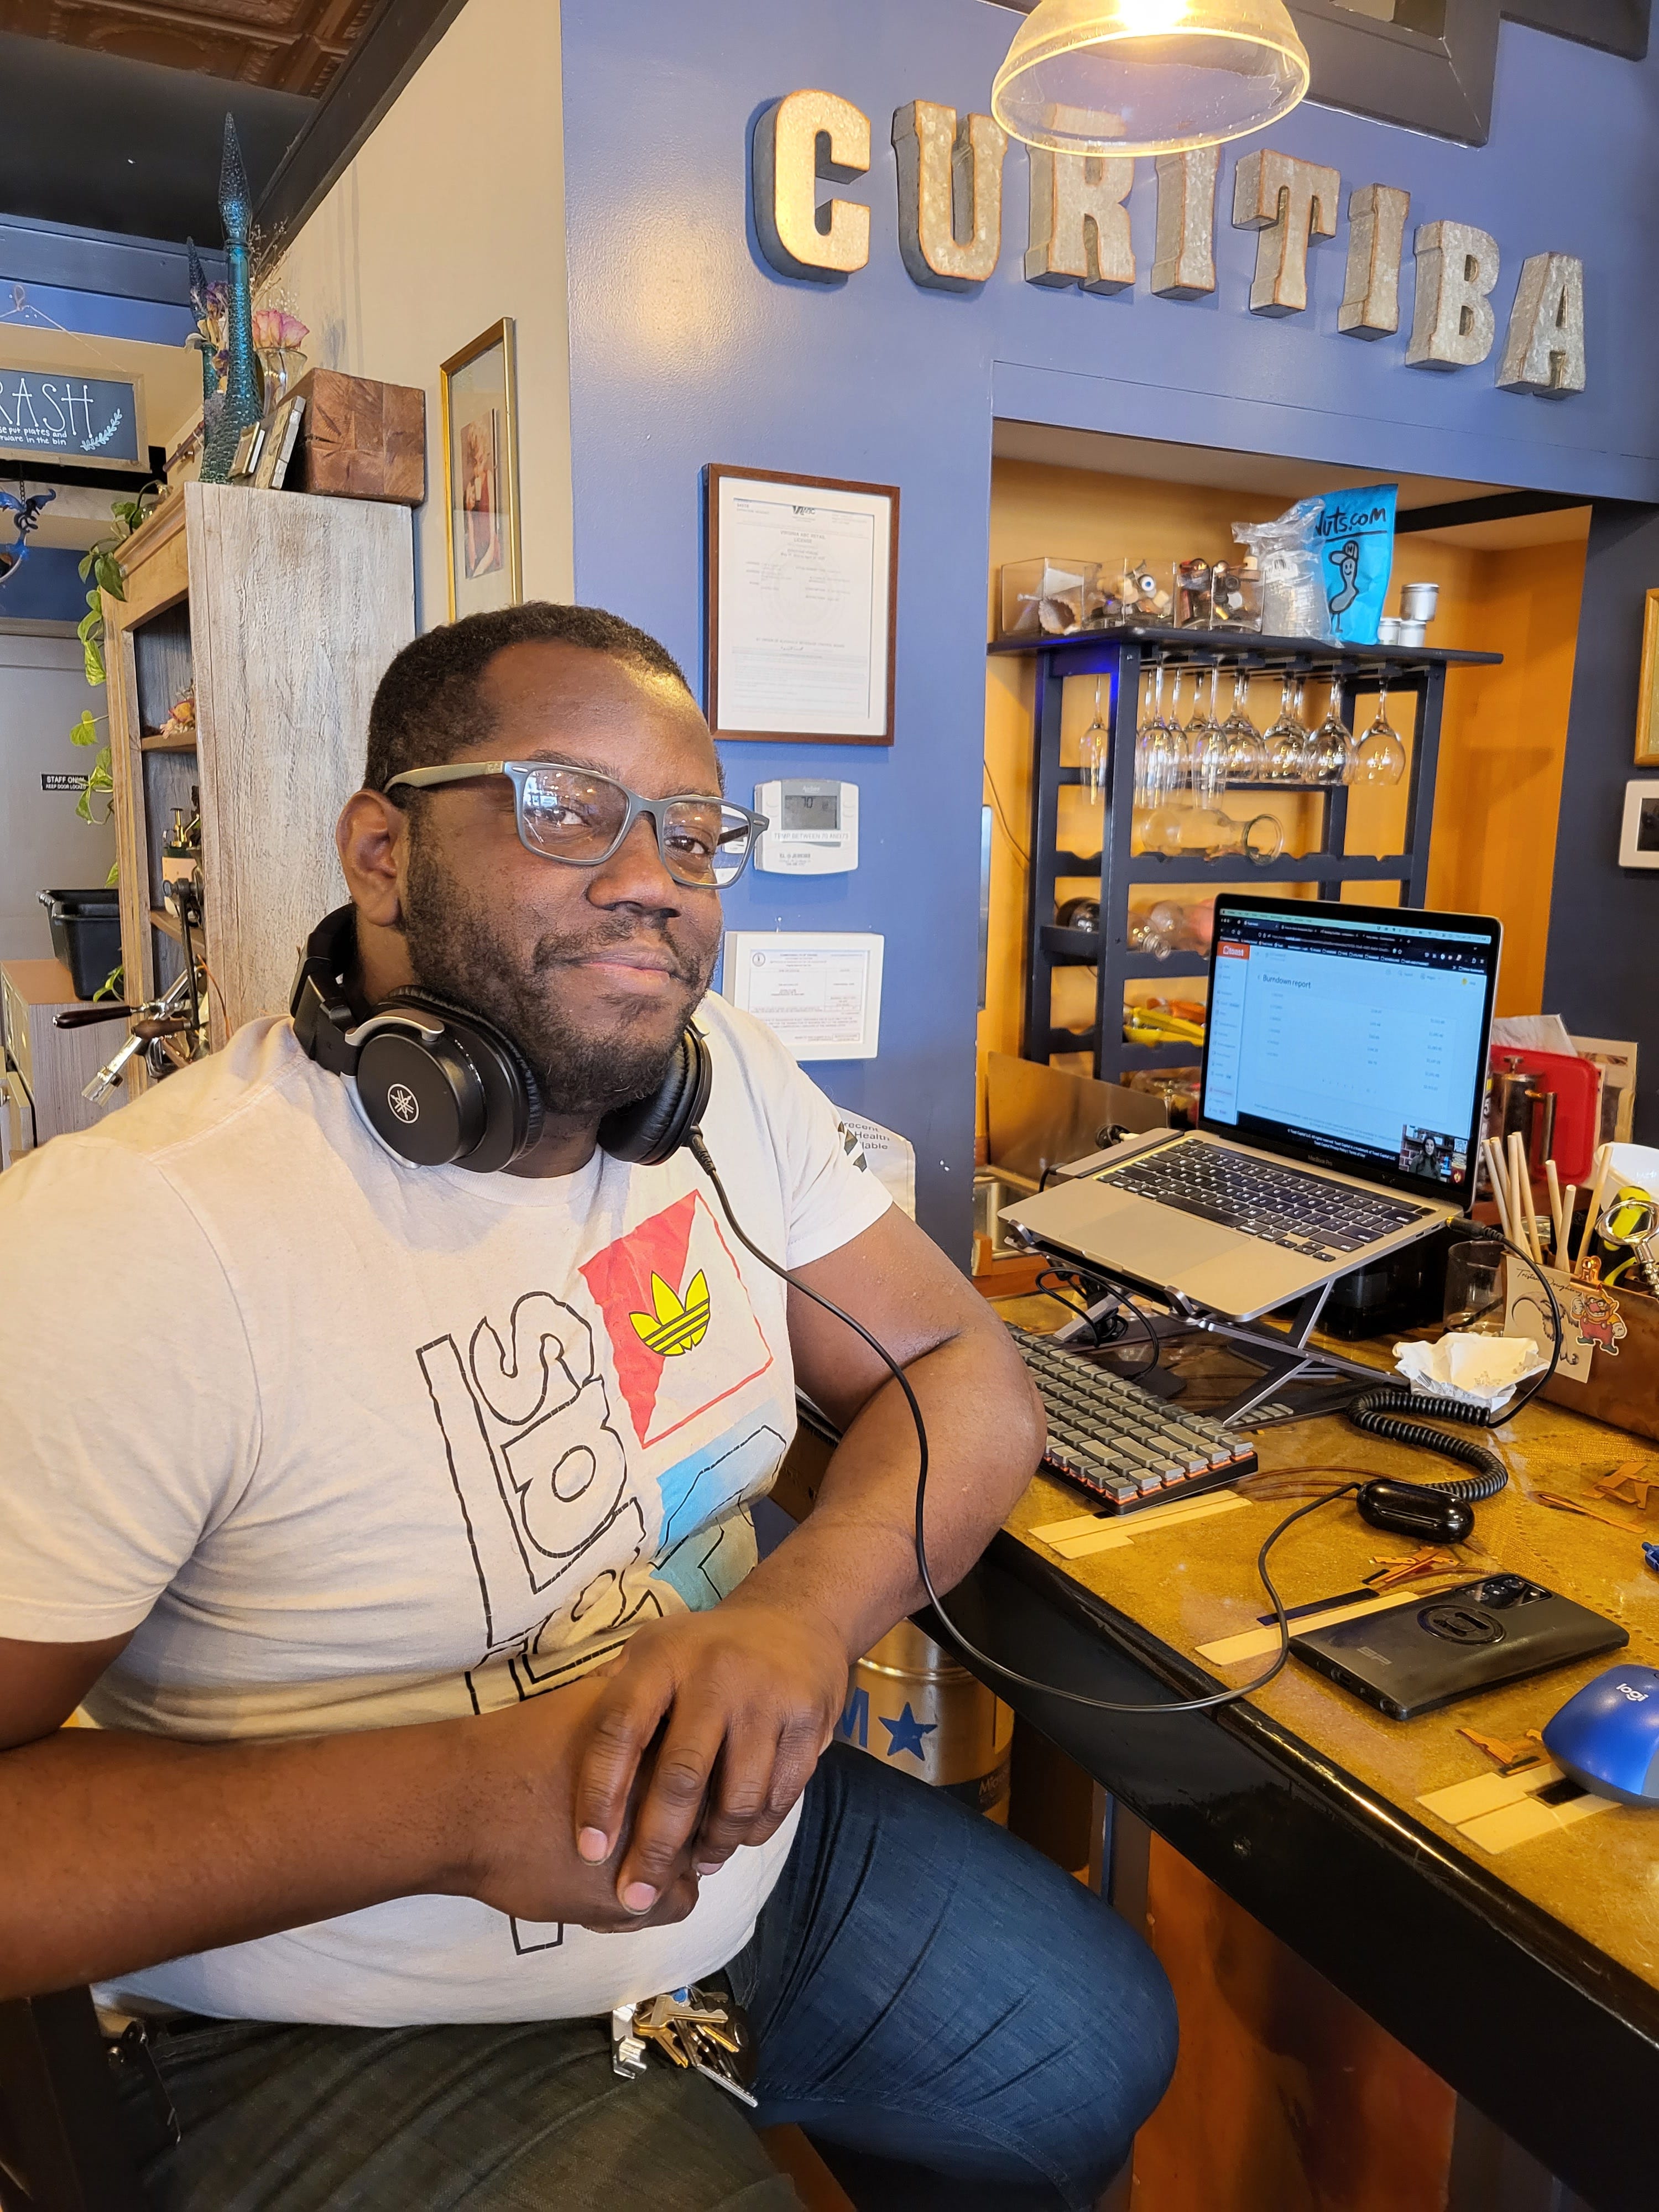
Curitiba co-owner Cori Blanche does more than manage the books, he manages the playlist at the coffee shop for artists in downtown Fredericksburg.
The arts, coffee, and humanitarianism combine in a picturesque setting at 919 Caroline Street - but the soul of Curitiba Art Cafe is in … wait for it … Curitiba, Brazil.
Recognized as one of the best run cities not only in Brazil, but the world, Curitiba is a recognized innovator in architecture, green technology, the arts, tackling intractable problems like homelessness, and much more.
Curitiba’s co-owners - Cori Blanche and Megan Samples - are innovators, too. Cori is a musician of long standing in the Fredericksburg area, and deeply committed to issues of justice. Megan is a humanitarian with deep experience in some of the world’s most troubled regions, like Haiti.
In the same way that Curitiba the city is recognized as one of the best places in the world to go and recharge your batteries, Curitiba the restaurant is a place to go and restore your soul. And you won’t need to catch a 14-hour flight from Dulles to get there. Just head downtown.