DIGITAL INSIGHTS: Baseball, Data Centers, and Economic Development
Do baseball stadiums juice the economy? Yes. And it's easy to see - ticket sales, jobs, food sales, and out-of-town visitors. Data centers juice the economy too, when you know what to look for.

By Martin Davis
EDITOR-IN-CHIEF
Email Martin


Digital Insights is a weekly feature usually appearing on Thursdays that explores the role of data centers in our region. These columns will focus on four areas: tracking the development of data centers in our area, exploring projected and actual tax revenue trends, explaining what data centers are and how they affect our daily lives, and reporting on research and emerging trends in the industry. These columns are made possible, in part, by a grant from Stack Infrastructure.
With the World Series behind us, local baseball fans are already dreaming about Spring Training and the return of the Fred Nats to Virginia Credit Union Stadium. There, they can sit in the sun with a beer and a dog watching America’s pastime play out.
What they aren’t thinking about are the economic impacts of the stadium on the region.

If asked to do so, however, finding examples to point out wouldn’t be difficult. There were the jobs created when the park was constructed. Then there are the dollars the ballpark itself attracts through ticket and concession sales for the roughly 65 home games played each year. Beyond that, there are also concerts and special sporting events and conferences that are ongoing whether or not the baseball season is in swing.
And then there are the spinoff benefits — visiting fans booking hotel rooms or attending events and dining out — that help to support and sustain the community beyond the ballpark. To borrow developer language, these are the multiplier effects of a stadium in the region.
If you’re asking why a Digital Insights column is talking about baseball — besides the author’s passion for the game — it’s because the description of how a ballpark benefits the community provides a blueprint for better understanding the multiplier effects of data centers.
With ballparks, it’s easy to see the thousands of people moving through ballparks and the surrounding community, spending money that benefits the economy as a whole — from ticket takers to hoteliers and restauranteurs.
Data centers, by contrast, have relatively few full-time workers, making it difficult to understand how they benefit the community as a whole.
Enter Ohio
A new study by Vista Site Selection, LLC — a company that helps businesses across a spectrum of industries locate sites to build — helps explain the multipliers that data centers bring to a region.
Focused on the state of Ohio, which currently counts about 200 data center sites, many clustered around the city of Columbus, the study uses real financial information from data center projects to model a hypothetical data center measuring 250,000 square feet and the economic impact it has on its community, region and state.
The study doesn’t compare this hypothetical project to a baseball stadium, but rather to a manufacturing facility also measuring 250,000 square feet. Comparing these two on a square-footage basis allows for an apples-to-apples comparison.
Economic impacts of the study’s hypothetical data center and manufacturing center are measured in three ways: Direct (measuring operations impact), Indirect (measuring impacts from suppliers to Direct activities), and Induced (re-spending of households from labor markets).
To put that in ballpark language, think ticket and concession sales (Direct), food suppliers and uniform cleaning companies and lighting companies (Indirect), and restaurants and businesses that receive business from people who work for the ballpark and its suppliers (Induced).
On those three levels, the study models each one’s economic impact.
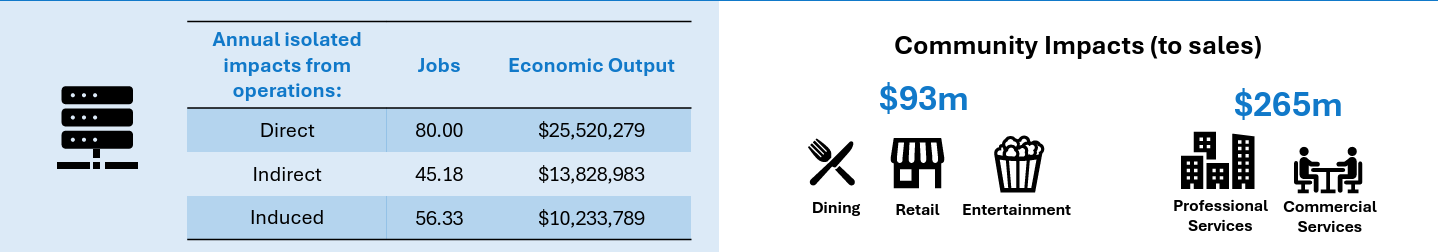
The figure above shows the economic impact of one 250,000 square-foot data center measured by the data center’s operations. (Two additional measures will be discussed below.)
The total number of all jobs from the operations side of a data center — Direct, Indirect, and Induced sources — is 181.51, with a total economic output of $49.6 million.
The overall financial impact on the total economy, however, is even greater. The data center yields $93 million to dining, retail, and entertainment establishments, and $265 million for professional services and commercial services.
How does that stack up to a same-sized manufacturing plant?
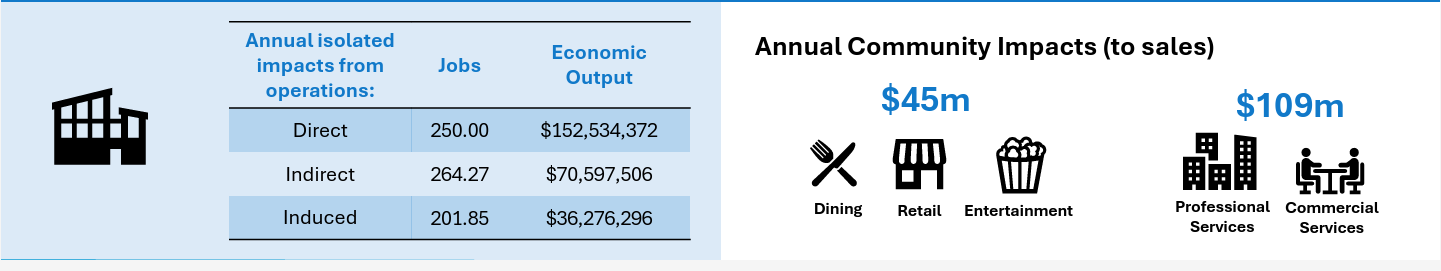
The manufacturing sector depicted in the graph above generates more jobs from operations — 716.12 — than does a data center (181.5), but relatively speaking, it generates considerably less economic impact.
Among Direct, Indirect, and Induced sources, $45 million goes to dining, retail, and entertainment ($48 million less than data centers generate), and $109 million goes to professional services and commercial services ($156 million less than data centers).
What’s important to remember is that these numbers are just from the operations side of the businesses.
When one adds in one-time construction impacts and machinery costs over a decade, the gap in total economic impact between the modeled data center and modeled warehouse facility become more pronounced.
Compare the modeled impacts for the data center

to the modeled warehouse

Yes — both are significant economic engines. But comparatively, the data center, with $1.4 billion more in annual economic output and $500 million more contributed to Ohio’s GDP and roughly 6,000 more direct + spinoff jobs dwarfs what is produced by the manufacturing facility.
Tax Revenues
The revenue-generation gap between a data center and a manufacturing facility is as stark when one looks at tax generation.
Let’s start with the modeled data center in Ohio
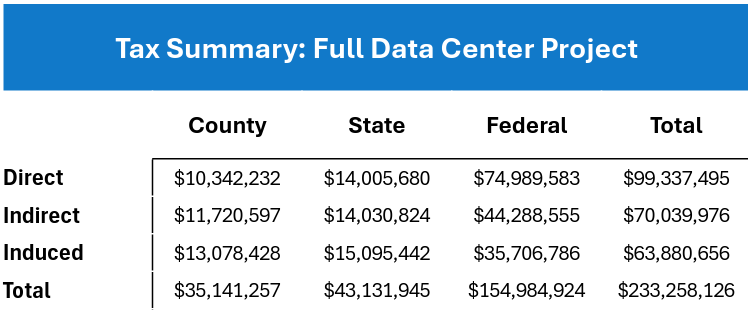
The figures above are modeled with the one-time construction impacts, ten years of machinery and equipment, and annual labor costs.
One data center in Ohio generates $10 million in direct tax revenue for a county, and nearly an additional $25 million in indirect and induced tax revenues.
At the state level, the Direct, Indirect, and Induced values are roughly equal. And at the federal level the Direct tax impact is nearly $75 million, with the Indirect and Induced costs being slightly lower.
Compared with the modeled warehouse, data centers again are significantly stronger economic drivers.
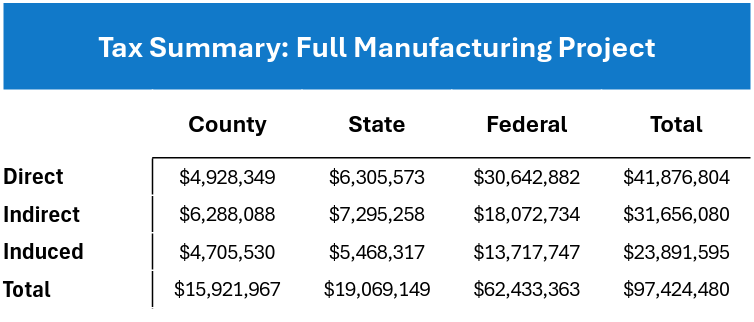
Whereas the total tax impact from the modeled data center is over $233 million, the warehouse generates $136 million less.
Far More Than the People Working in the Building
What too frequently gets lost in the economic impact discussions of data centers is an appreciation for the full financial impact the business has as it’s spread across the community.
While data centers will not match a warehouse in the number of jobs it produces on-site, in almost every other way, data centers produce significantly more revenue and have a more profound ripple effect across the economy.
As our region looks to data centers coming online, it is important to look beyond the people with badges going into the doors when measuring their impact on the community.
Frequently, its the tax benefits that get highlighted. And these benefits are significant and rightly focused on.
But the impacts on business suppliers and the employees they hire, as well as the coffee shops and movie theaters and housing projects and parks and all the other amenities people associate with a healthy community, are not to be overlooked.


Local Obituaries
To view local obituaries or to send a note to family and loved ones, please visit the link that follows.

Support Award-winning, Locally Focused Journalism

The FXBG Advance cuts through the talking points to deliver both incisive and informative news about the issues, people, and organizations that daily affect your life. And we do it in a multi-partisan format that has no equal in this region. Over the past year, our reporting was:
First to break the story of Stafford Board of Supervisors dismissing a citizen library board member for “misconduct,” without informing the citizen or explaining what the person allegedly did wrong.
First to explain falling water levels in the Rappahannock Canal.
First to detail controversial traffic numbers submitted by Stafford staff on the Buc-ee’s project
Our media group also offers the most-extensive election coverage in the region and regular columnists like:
And our newsroom is led by the most-experienced and most-awarded journalists in the region — Adele Uphaus (Managing Editor and multiple VPA award-winner) and Martin Davis (Editor-in-Chief, 2022 Opinion Writer of the Year in Virginia and more than 25 years reporting from around the country and the world).
For just $8 a month, you can help support top-flight journalism that puts people over policies.
Your contributions 100% support our journalists.
Help us as we continue to grow!


This article is published under Creative Commons license CC BY-NC-ND. It can be distributed for noncommercial purposes and must include the following: “Published with permission by FXBG Advance.”
Thank you once again to 'FXBG Advance' for making sure to post that these weekly 'Rah-Rahs DCs! are because Stack Infrastructure funds these shills in promoting their billion-dollar industry FOR DATA CENTERS.
[Reader: Be sure to 'refresh' and click 'Expand Full Comment' in blue at end of article to read the full comments submitted on Substack].
Stack is the developer for the 8-12 DATA CENTERS going out in the Technology Overlay District near the Fred Nats ball park. They'll be located not in an industrial park, as the JLARC General Assembly (12-9-24) DATA CENTER report recommends.
but in two neighborhoods, the apts and 'Jubilation' for senior living in 'Celebrate Virginia'.
They're positioned near the historically marginalized families with children living in the apartments out there, surrounded on 3 sides by DATA CENTERS.
hmmm, so much Equity talk from these virtue signalers on this Council, talking the talk, but not much Walk the Talk. Same goes for their clone replacements.
Not one Councilor or the mayor spoke up for those children who will have to endure 24/7 noise generated by these behemoths. Prince William/NoVA news sources report that children are experiencing headaches and are struggling to fall asleep at night.
Connecting the Fred Nats to these DATA CENTERS in this article? What we're hearing from regional folks is can they be harmed by those DATA CENTERS being so close to the ball field?
Any primary source research on that question?
DATA CENTERS are heavily subsidized through various government incentives like sales and property tax exemptions, tax credits, and other deals designed to attract investment.
In addition, utilities can indirectly subsidize data centers by shifting costs from negotiated, lower rates for these large customers to US, THE RATEPAYERS, leading to HIGHER electricity bills for US, THE CONSUMERS.
Fingers crossed that the SCC State Corporation Commission will come through by 12-31-2025 for US, THE RATEPAYERS.
WE THE RATEPAYERS are the ones in the Commonwealth of Virginia having the undue burden to fund this billion-dollar DATA CENTER industry through hidden fees embedded within our power bills.
Even if there's no chance in heck that a locality will ever get a DATA CENTER built in their city/county, the RATEPAYERS in Virginia are paying for Virginia being the DATA CENTER capital of the world.
DATA CENTERS are known for their cost shifting. When the cost to serve their DATA CENTERS anywhere in the Commonwealth of Virginia is higher than the negotiated rate, 'fox-guarding-the-henhouse' monopoly Dominion Resources can pass the difference on to residential consumers, through higher rates.
SCC, come through for us!
There is no cloud. Merely someone else's computer which holds your data.
Moore's law - The number of transistors on an integrated circuit doubles every two years.
I'm not a fan of infomercials. When I see or read one, I tend to go the other way. When I see one from a source that presents itself as unbiased and objective, it diminishes the value of that source substantially in my eyes.
And raises questions.
This study from Ohio (as if anyone in this benighted land is dreaming of molding themselves in direction of the state that has given us JD Vance), did Mr Davis find it himself, or was he steered to it by this group that is paying him to tout the benefits of MyPillow,.... sorry - data centers?
Because one wonders how cherrypicked the data is.
There may be benefits of data centers. Yet with all that has happened in the last 40-50 years with our entrusting our data, even our lives to corporations in return for cheaper prices and ease of use - you can't help but notice that the rich are getting richer and the poor are getting poorer.
Pardon me if I worry if Elon "Katemine Kid" Musk or Jeff "My employees are on food stamps while I rent Venice for parties" Bezos are people whom I should trust to make decisions for what's best for our communities. No matter how much "philanthropy" they send to those who presents themselves as unbiased purveyors of truth to present their side of the story.
When I see studies of an imaginary factory compared to a data center, like Rodney Dangerfield in that cinematic masterpiece "Back to School", I can't help wonder about how realistic the comparison is.
We know that these data centers will be looking to minimize the amounts of servers they are having to service to get the same amount of work. And Moore's law seems to show they will likely succeed, as computers enter the quantum age.
Will that translate to increased value, increased costs, or a reduction in taxes paid?
Hard to say, but most corporations look to increase efficiencies, lower costs, including taxes - or move to more profitable areas over time. Their duty, no matter how loud the commercial - is to their shareholder's profits, not the community. We should never forget that. They won't. They legally can't. To do so would be malpractice and negligence.
Point being, what numbers are true today on all of those things will most certainly be different 30-40 years from now.
But we know that we're going to have to build nuclear power plants to meet these centers demands. A 10,000 year risk/cost for a 30 year questionable gain?
Hmmmm.
What's that old saying about when something sounds too good to be true?
We know that governments are signing agreements based on hopes and projections of a poorly understood industry because of its newness where there are likely questions we haven't even thought to ask.
We know we're signing over water rights that may impact us for generations.
And that more and more of our "representatives" - whether they be in government, academia, or...ahem the 4th estate - seem to be coming into largesse that makes one wonder who exactly they are representing.
So how much of this is true, I can't say.
Though, coming from a land that was made up of company towns - too often we saw that the company benefitted at the cost of those living there.
It was the hidden costs that got you.
The unfunded black lung or chemical dump cleanup. Workman's comp and safety laws to benefit the factory, not the worker. Wages suppressed. You know, sorta like we're seeing now under Republican guardianship.
So pardon me if I take this epistle of fact finding with a mountain of salt.
Experience gave it to me.