FROM THE EDITOR: The Nation's Report Card Has Bad News ...
... our battery of tried-and-true solutions won't fix it.

By Martin Davis
EDITOR-IN-CHIEF
Email Martin

The top-line takeaway from the latest round of analysis of the 2024 National Assessment of Educational Progress (NAEP) test was startling: “The Nation’s Report Card Reveals Declining Scores for Students Entering and Exiting High School.” That was the headline from the NAEP press release.
It also produced a predictable round of reactions.
U.S. Secretary of Education Linda McMahon said the results “confirm a devastating trend” of academic achievement. Her solution? “The lesson is clear. Success isn’t about how much money we spend, but who controls the money and where that money is invested. That’s why President Trump and I are committed to returning control of education to the states so they can innovate and meet each school and students’ unique needs.”
A report on NPR explored concerns about future NAEP exams owing to cuts in funding under the Trump administration.
The New York Times blamed the pandemic, but also pointed the finger at screen time: “Over the last decade, both adults and children began to replace reading time with screen time, social media and, increasingly, streaming video.”
This marks only a partial list. What everyone agrees on is that the scores are bad. What there’s little agreement on is what to do about it.

What NAEP is and isn’t
So how bad were the results? Well, pretty awful. But before digging in, it’s important to understand what NAEP is, and what it is not.
The exam is given every few years to a representative sample of students from across the country. This means that with few exceptions, one can’t use NAEP to drill down to individual school districts. Thus, reports tend to come in at both the national and state levels.
This should be cause for caution. Consider Virginia.
The commonwealth is incredibly diverse in education access and experience. No one would rightly say that what happens in Alexandria can be compared to what happens in Wise, Virginia. Take it one step further — one wouldn’t compare what happens in Fredericksburg with what happens in Stafford. So keep that in mind when looking at state level NAEP results.
With that in mind, here are three important takeaways in interpreting NAEP results:
Don’t look for cause and effect. The NAEP website itself is clear: “NAEP is not designed to identify the causes of change in student performance.” Simply put — NAEP is a very good tool for capturing change in student performance, but understanding what is driving that change is beyond the scope of NAEP.
NAEP “proficient” does not correlate to state grade-level performance expectations. A game that is frequently played by critics of public schools — and Virginia Governor Glenn Youngkin has done so repeatedly — is to compare NAEP proficient scores to state SOL proficient scores and argue there is an “honesty gap” — i.e., SOL proficient scores are higher than NAEP Proficient scores. Therefore, the governor has claimed, the state scores are deceiving people. NAEP is clear that this comparison is incorrect: “In 2018, the National Assessment Governing Board issued a revised policy statement clarifying that the NAEP Proficient level is not intended to reflect grade-level performance expectations but is specific to performance on NAEP assessments.”
NAEP is not keyed to any set of state standards. The NAEP exam is constructed, and administered, by the National Assessment Governing Board. It is not keyed to any state standards. The 2018 Policy Statement explains the development of NAEP achievement levels this way: “The development of content achievement level descriptions (ALDs) shall be completed initially through the process that develops the assessment frameworks. (See the Governing Board Policy on Framework Development for additional details). The Board may then review and revise content ALDs to advance the purposes they serve, whether that is guiding an achievement level setting or informing the public about the meaning of achievement levels. Whether revised or not, the ALDs that guide 5 achievement level setting shall be articulated in terms of what students should know and be able to do.”
An Ugly Reality
The report released this past week focused on 12th-grade math and reading performance. The scores reported out were mostly national scores, though 13 states also had scores revealed. State-level results are not available for Virginia.
NAEP exams are reported at three levels. (Read more here):
Below NAEP Basic: this level denotes partial mastery of prerequisite knowledge and skills that are fundamental for performance at the NAEP Proficient level.
NAEP Proficient: this level represents solid academic performance for each NAEP assessment. Students reaching this level have demonstrated competency over challenging subject matter, including subject-matter knowledge, application of such knowledge to real world situations, and analytical skills appropriate to the subject matter. (Editor’s Note: Again, remember that NAEP Proficient is not the same as a Proficient score on the SOL.)
NAEP Advance: this level signifies superior performance beyond NAEP Proficient.
So how bad are they? Here’s a look by subject matter.
Math
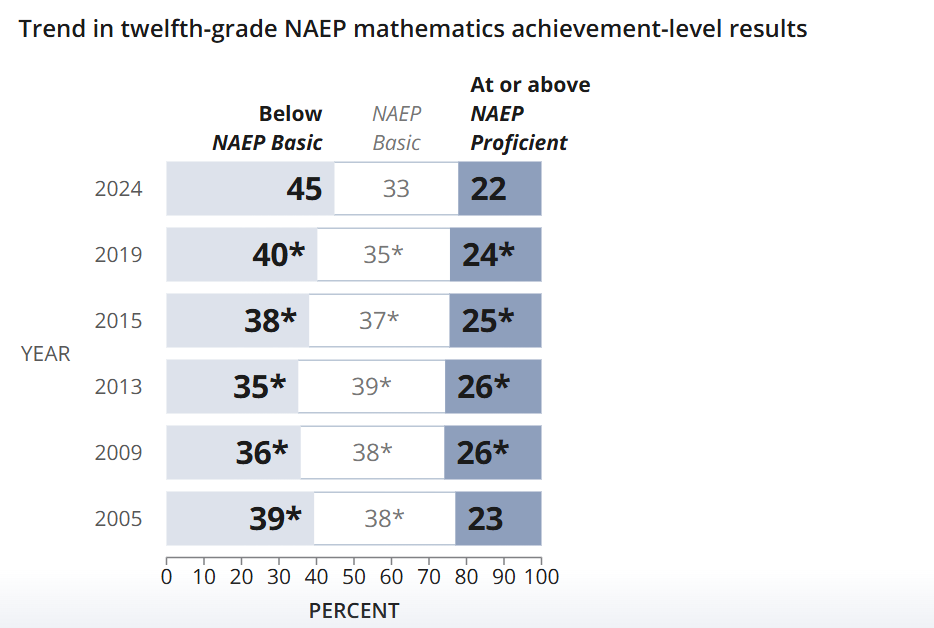
The number of 12th-grade students performing Below NAEP Basic in math now registers a whooping 45%. This is the highest number seen since at least 2005.
Concurrently, the decline in students performing At or Above NAEP Proficient that began in 2015 has accelerated. We’ve also seen a drop in the percentage of students performing at the NAEP Basic level.
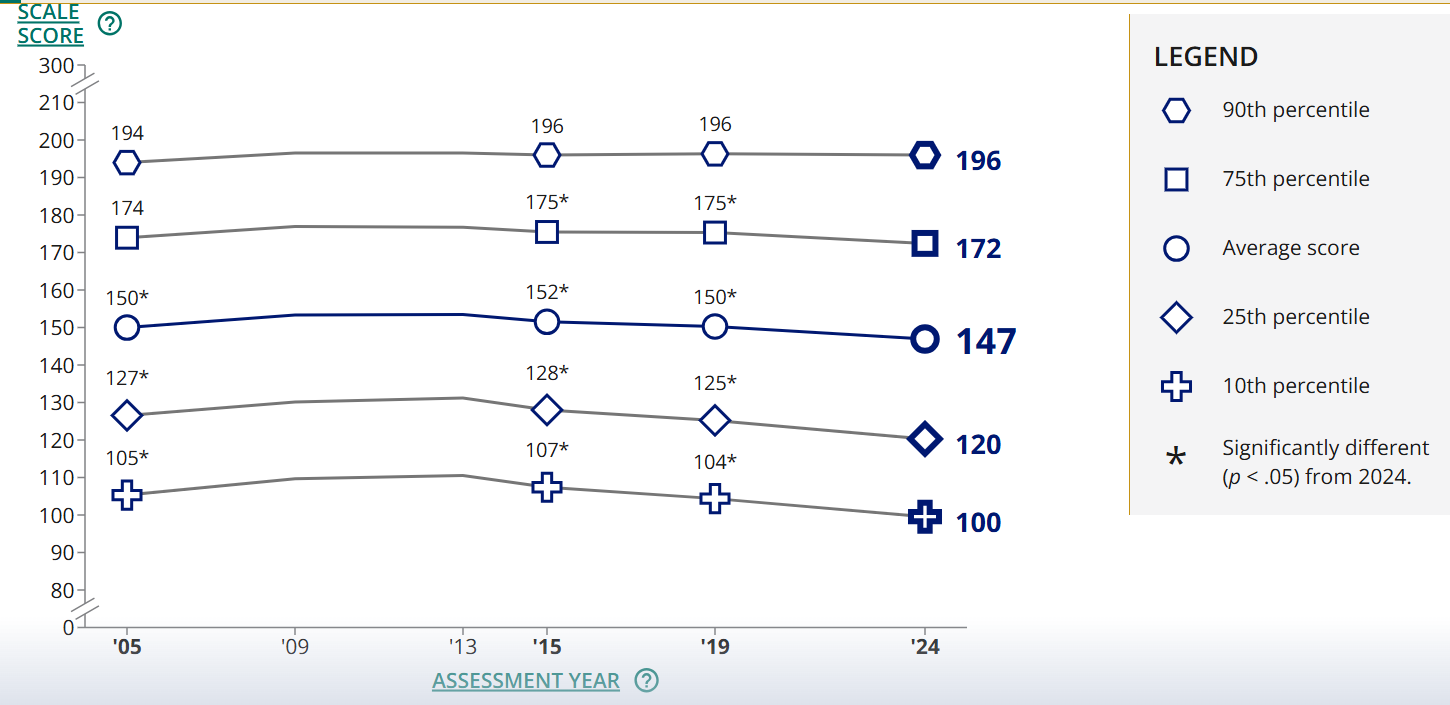
The picture changes a bit, however, when we look at performance by percentiles. Students performing at the 90th percentile level are doing as well today as they were doing in 2005. And students in the 75th percentile, while down, have not fallen off the proverbial cliff since 2019, though their scores have declined.
The sharpest drops occur among those students scoring in the 25th and 10th percentiles.
This pattern will repeat itself with the reading scores.
Reading
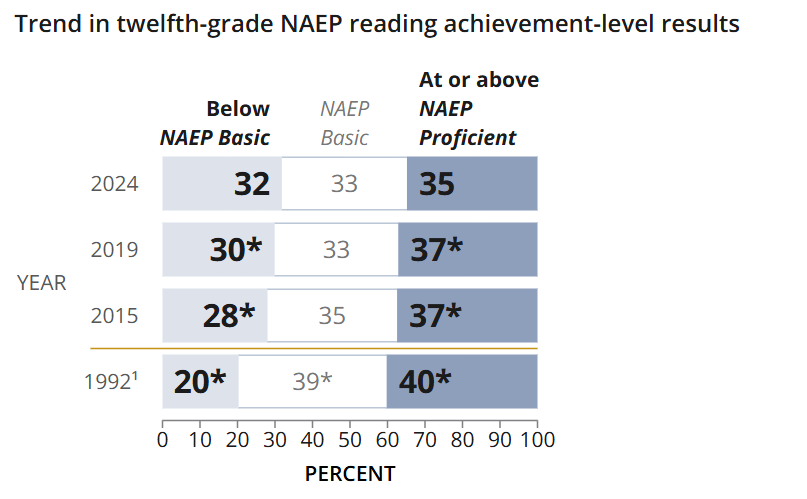
Between 1992 and 2015, there was a statistically significant drop in the percentage of students scoring at NAEP Basic
The change in students scoring Below NAEP Basic has steadily risen between 1992 and 2024. Concurrently, the percentage scoring at or Above NEP Proficient has risen.
Not all groups of students underachieved, however.
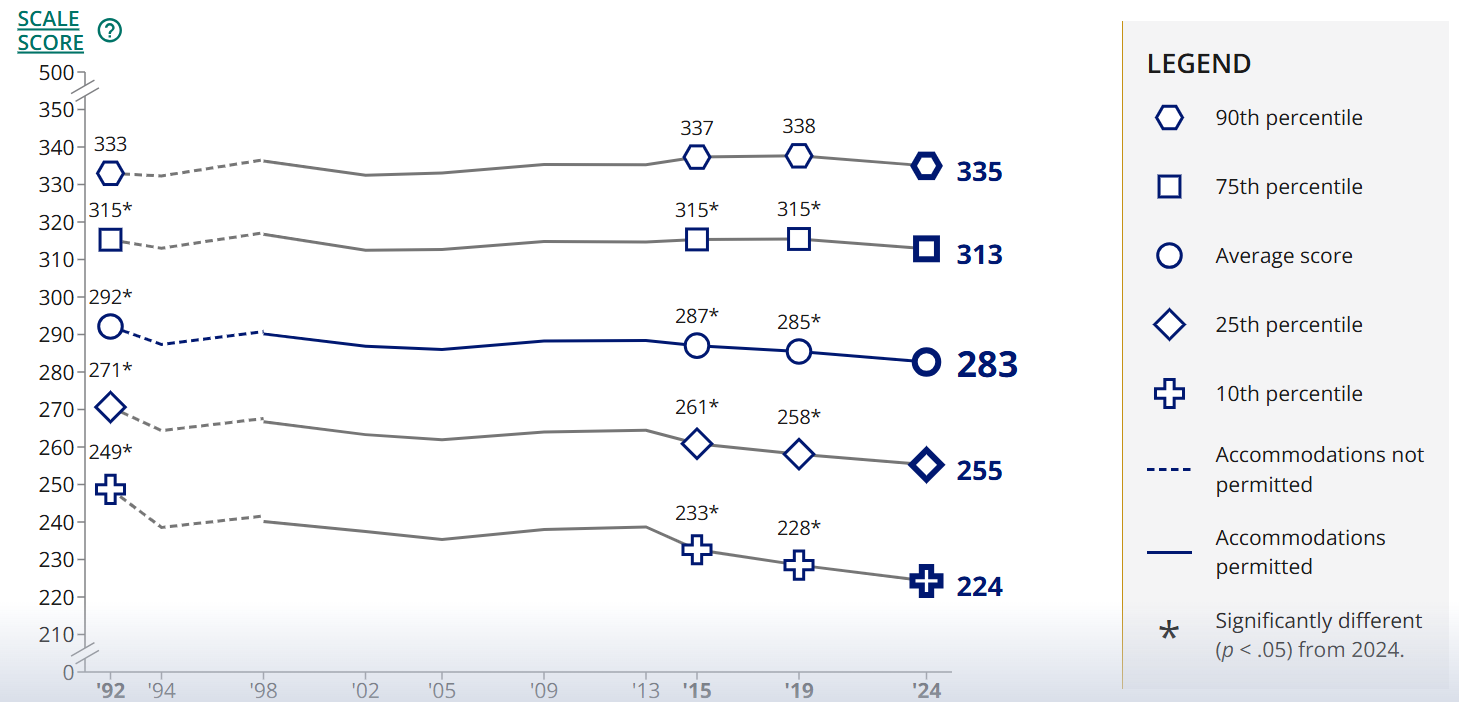
Students in the 90th percentile are doing as well today as they were in the early 1990s. And while students in the 75th percentile are statistically worse off than in the early 1990s, the drop only occurred in the 2024 results.
The significant drops are seen in students scoring at the 25th and 10th percentiles. These scores are what pulled the average score down.
What Does It All Mean?
Robin Lake is director of the Center for Reinventing Public Education (CPRE), and her summation of the findings is one to pay attention to.
Of the math scores, Lake says: “Math achievement is in a downward spiral and it is not just a pandemic problem. In 2024, the average grade 12 mathematics score was the lowest it has been since the current assessment began in 2005.”
Of learning gaps, Lake says: “Gaps are becoming chasms. With declining scores for lower-performing students at the 10th and 25th percentiles, the achievement gap between the highest- and lowest-performing students continued to widen and was larger in 2024 than in all previous assessments.”
Perhaps most damning is this assessment:
Students know they are not learning enough. Thirty-six percent of twelfth-graders in 2024 reported having a high level of confidence in their mathematics knowledge and skills—down from 38 percent in 2019.
“The results are a scathing reminder,” she said, “of what we already know too well: U.S. student achievement is in a downward spiral. We can’t solve these problems with ideological rhetoric or piecemeal policy shifts; we need to attack from multiple fronts: better preparedness for teachers, evidence-based help for struggling students, honest data for parents, and a system designed to ensure all students master foundational skills.”
CPRE will be issuing a report on Tuesday that the Advance will be watching. It will do a deep dive into why these declines are happening.
For now, it’s worth focusing on this point that Lake makes: “We can’t solve these problems with ideological rhetoric or piecemeal policy shifts.”
Vouchers, “returning education to the states,” charter schools, intensive tutoring, and more are little but “piecemeal policy shifts” and “ideological rhetoric” that Lake refers to.
Virginia Can Lead
Virginia was a leader in pushing the nation toward standards’ based learning. When Gov. George Allen led the push for high-stakes SOL tests, the nation followed. The 2001 No Child Left Behind Act was modeled in large measure on what Virginia built.
A quarter century on, it should be clear that standards’ based education has been an abject failure.
With an election in November, Virginia is in a position to act in a way that can potentially lead to the types of dramatic shifts in thinking that are necessary to address education.
The problem is that, unfortunately, neither Winsome Earle-Sears, who leans heavily into “choice,” nor Abigail Spanberger, who leans into more money for the status quo and technical education, are likely to prove the types of forward-thinking governor Virginia desperately needs to get public education back on-track.
Campaigning, of course, is not governing. Whoever sits in the governor’s chair come January 2026, let’s hope that person sets aside what they ran on for serious reform. If the two candidates are really serious about education reform, they will listen to people like Robin Lake.
There are models to look to — the Center for Reforming Public Education has an entire series of new ideas of public education that can serve as a starting point for discussion.
We have a once-in-a-generation opportunity to fix what standards-based learning has destroyed. Donald Trump is not remotely interested in fixing public education. Just the opposite. He is undermining it by cutting funds and potentially crippling the governing body that produces NAEP — the single best analysis we have for understanding student achievement.
If there’s an upside, it’s this. Cuts to education funding mean the states are untethered from Donald Trump’s and federal government’s overreach into local education.
Reject federal dollars. Avoid simple solutions — “choice,” pouring more money into the K-12 educational juggernaut (professional development, computer technology, and top-heavy central offices) — and look to embrace real reform.
Robin Lake is a great place to start.
I can make an introduction, if either governor-to-be is interested.
Our new governor needs to step boldly.
We will not have a better opportunity than now.


Local Obituaries
To view local obituaries or to send a note to family and loved ones, please visit the link that follows.

Support Award-winning, Locally Focused Journalism
The FXBG Advance cuts through the talking points to deliver both incisive and informative news about the issues, people, and organizations that daily affect your life. And we do it in a multi-partisan format that has no equal in this region. Over the past year, our reporting was:
First to break the story of Stafford Board of Supervisors dismissing a citizen library board member for “misconduct,” without informing the citizen or explaining what the person allegedly did wrong.
First to explain falling water levels in the Rappahannock Canal.
First to detail controversial traffic numbers submitted by Stafford staff on the Buc-ee’s project
Our media group also offers the most-extensive election coverage in the region and regular columnists like:
And our newsroom is led by the most-experienced and most-awarded journalists in the region — Adele Uphaus (Managing Editor and multiple VPA award-winner) and Martin Davis (Editor-in-Chief, 2022 Opinion Writer of the Year in Virginia and more than 25 years reporting from around the country and the world).
For just $8 a month, you can help support top-flight journalism that puts people over policies.
Your contributions 100% support our journalists.
Help us as we continue to grow!


This article is published under Creative Commons license CC BY-NC-ND. It can be distributed for noncommercial purposes and must include the following: “Published with permission by FXBG Advance.”
Public schools across the US are the largest single spending category for local governments and are a major component of state budgets. Local governments spend a significant portion of their budgets on elementary and secondary education, with a substantial portion of these funds coming from state and federal contributions despite being administered at the local level.
Imagine what you could do as a Billionaire corporation in diverting that taxpayer money to get to the Trillion dollar mark for your personal benefit.
and at the same time, be able to 'cherry pick' the preferred students who are admitted to your billion-dollar charter school industry to fake out proof that your charter school works.
Yes, Virginia:
charter schools can "cherry pick" students.
While they must operate through a lottery system if oversubscribed, subtle strategies like complex applications, requiring volunteerism, or steering applicants away from specific programs can be used to create a more selective enrollment pool.
The standard MO is to Knock off access to that fancy 'bells and whistles' charter school, sometimes located in a vacant office park, e.g., York River Academy? and which eventually ends up in the strip shopping center to cut costs so the owner's profit margin increases., Dare Co. OBX, NC.
Students with disabilities. have powerful federal civil rights to procedural safeguards and due process under the IDEA, Individuals with Disabilities in American's public schools. But charters don't have to accept them.
CRPE research has examined topics like charter schools, district-charter collaboration, education finance, innovation, and post-pandemic recovery.
The Center on Reinventing Public Education has released press releases that:
advocate for a common set of "education reforms" such as standardized testing, measuring "teacher quality," charter schools, school choice, and "accountability for school performance. They criticize the "last in, first out" policy for teacher layoffs that protects teacher seniority and
advocate for reductions in teacher pay
The Center on Reinventing Public Education (CRPE) receives funding from both corporate and private philanthropic foundations, as well as the U.S. Department of Education. This funding structure leads to conflicting views on the legitimacy and impartiality of its research.
CRPE is a self-sustaining organization that receives grants from a mix of private and public entities. Noteworthy funders over the years have included:
Philanthropic foundations: Walton Family Foundation, Bill & Melinda Gates Foundation, Carnegie Corporation of New York, and Laura and John Arnold Foundation.
Government grants: CRPE receives contracts and grants from the U.S. Department of Education.
Corporate interests: According to SourceWatch, CRPE is an "industry-funded research center" and also receives money from corporate sources.
Arguments questioning its legitimacy
Critics accuse CRPE of promoting a pro-charter, "free-market" agenda that is influenced by its wealthy, private donors.
Allegations of bias: Critics argue that CRPE's research is not ideologically neutral and promotes policies favored by its funders, such as charter schools and school choice initiatives.
Comparison to ALEC: The Progressive.org has compared CRPE's operational style to the American Legislative Exchange Council (ALEC), Grover Norquist's anti-tax ideology to decimate US public education (as well as revive decapitation in the prisons).
CRPE and Norquist's organizations are funded by "free-market-focused special interests".
Critics continue to point to CRPE's historical focus on the "portfolio strategy"—a model that treats a school district like an investment portfolio and promotes charter schools and autonomous schools—as evidence of a predetermined agenda.
So no CRPE. Don't buy it. US Public education is open to ALL students. It's likely we're going to be moving to robots as teachers, sooner rather than later, because of the teacher shortage. but we need to hold on to our form of in-person public education for as long as we can. For the common good.
Martin, you only need to look back a few years when the state of our city schools was brought to your attention. You excused and indicated the metrics were not an appropriate measure citing a book/ report some Californian published. These kids need to want to excel. Something segments of our society attempt to debred as being not appropriate. Tip said all politics is local. I say all education is local. How can you support our school system in bottom 10 percentile of Virginia schools?
Just fyi, I admit not reading your column in totality, but you give no reason to do so and no credibility to all you publish.
Firm but fair.